Machine and PLC layer
Map analogue signals or digital registers, scaling, status bits, recipes, interlocks and control permissions.
Data and integration
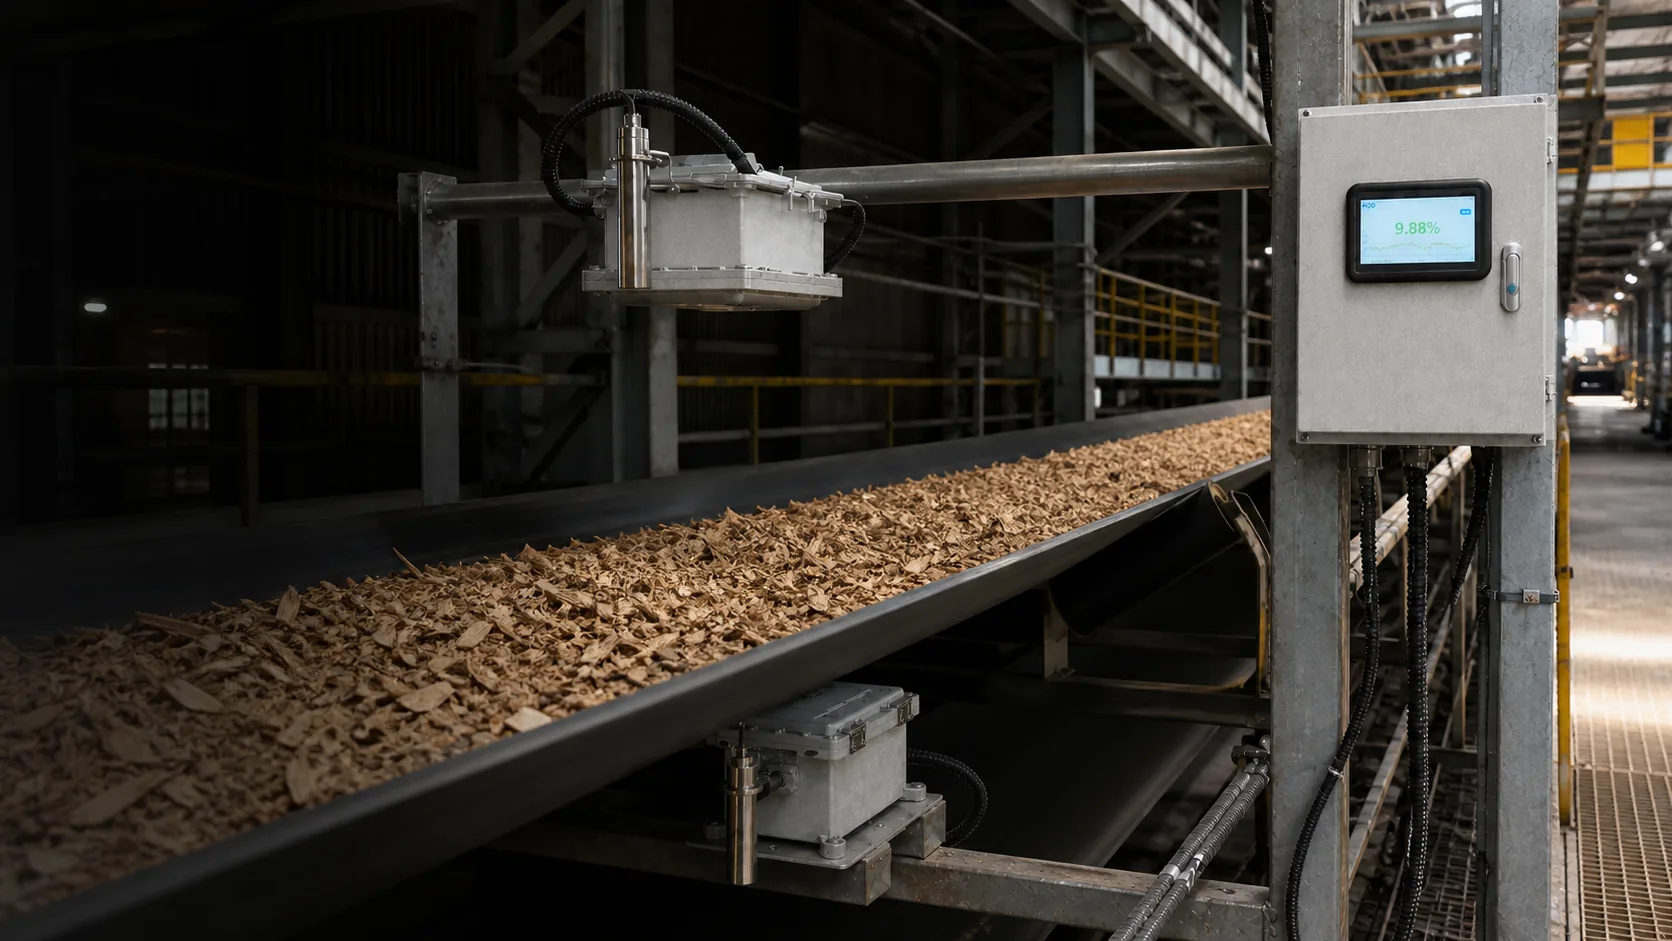
The moisture value creates value only when its timestamp, quality state, material identity and process context reach the people or systems that make decisions.
Data and integration
The moisture value creates value only when its timestamp, quality state, material identity and process context reach the people or systems that make decisions.
Map analogue signals or digital registers, scaling, status bits, recipes, interlocks and control permissions.
Trend moisture with line speed, density, temperature, batch, supplier and laboratory references.
Define alarm ownership, configuration backups, user access, remote-support boundaries and change records.
Software in operation
The interface demonstrations below are based on the bale, full-truck and board-analysis functions recorded in current product materials. They show how live values, section profiles, material identity, calibration and plant communication work together.
Demonstration interface · simulated operating data · AI suggestions require operator review and do not replace project rules
The latest profile widens at sections 5-6 before falling at section 8. Check bale position, compaction and height compensation; pair a reference sample if the pattern repeats.
Section values remain close to the current load baseline. Confirm scan coverage and vehicle/supplier identity before grading or settlement.
Compare the next boards and check temperature, alignment and product identity before changing thresholds or calibration.
Reference samples remain linked to the online time window, material and model version before a calibration is released.
| Sample | Online % | Reference % | Data state |
|---|---|---|---|
| S-01 | 6.92 | 7.05 | Calibration set |
| S-02 | 7.38 | 7.31 | Calibration set |
| S-03 | 8.04 | 7.96 | Validation set |
| S-04 | 7.71 | 7.82 | Validation set |
Control objective first
A useful integration carries more than one moisture number. It identifies whether the value is valid, which product or supplier it belongs to, when the measured material reaches the control point and how operators can override or acknowledge the resulting action. This definition prevents a live signal from becoming an unexplained tag in the PLC.
State whether the data supports display, alarm, recipe correction, dryer control, classification, supplier comparison or quality release.
Document engineering units, scaling, update rate, valid and fault states, product identity, calibration version and time source.
Match sensor time to transport delay, sample time, actuator response and batch boundaries before calculating averages or control errors.
Simulate normal, high, low, invalid and communication-loss states; then control access, backups and change records for every deployed configuration.
Integration package
The signal map is matched to the selected hardware, software version and plant architecture, including the required analogue, serial or network interfaces.
Automation context
Data-chain failure modes
Holding the last good value during a fault can drive the wrong action unless validity travels with the measurement.
Comparing a sensor value with the wrong laboratory sample or actuator position creates apparent error even when both measurements are sound.
A scale, register, recipe or calibration change without version history breaks traceability and makes later troubleshooting slow.
Share a few process details and our application team will recommend a suitable technology, installation concept and validation plan.