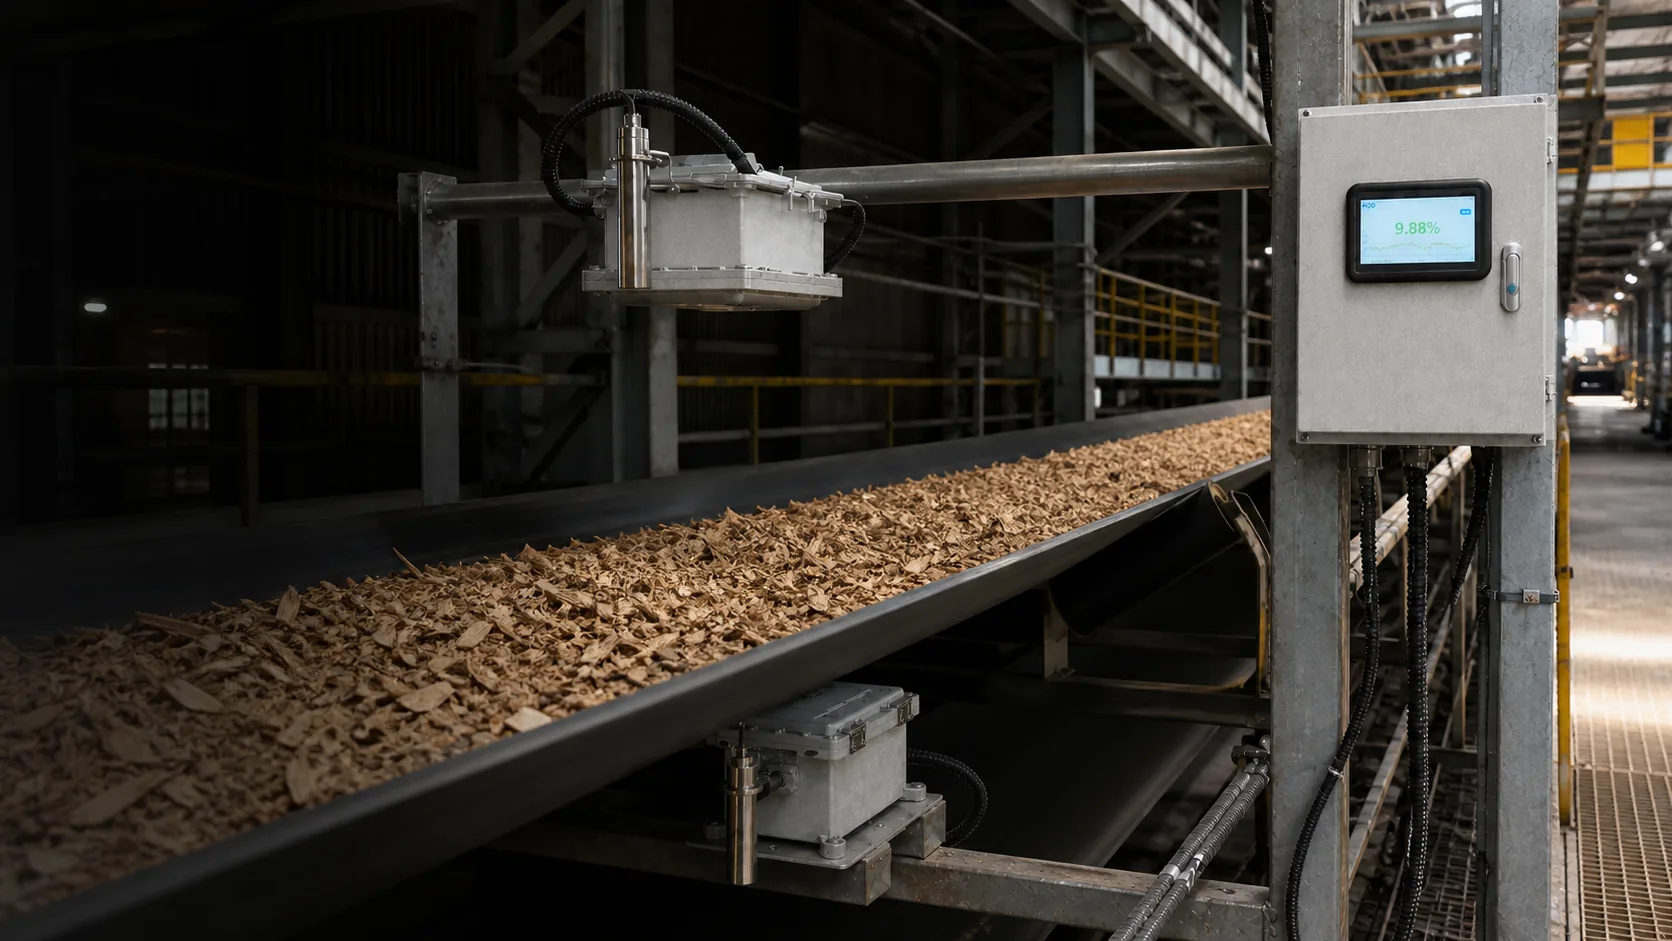
Performance depends on the material, reference method, operating range and installed configuration described in the project.
1–2: Sample volume and timing do not match
A small grab sample may not represent a wide belt, bale or truckload. The material reaching the sample point may also have passed the sensor seconds or minutes earlier. Define increments, positions, travel delay and averaging.
3–4: Measurement depth and reporting basis differ
NIR may respond mainly to the surface while a laboratory sample is mixed through depth. Wet-basis and dry-basis percentages are also different mathematical results and must never be compared without conversion.
5–6: Sample handling and reference variation
Unsealed samples can lose or gain moisture. Grinding, drying temperature, endpoint, volatile matter, balance performance and analyst practice contribute variation to the reference result.
7–8: Material conditions and installation have changed
Density, bed depth, temperature, particle size, colour, formulation, sensor distance, build-up and alignment can move outside the calibrated relationship. Data scaling, filtering or the wrong PLC tag can add another apparent difference.
Diagnose in a fixed order
Start with identity and timing, then reference method, measurement basis, production variables, installation and finally model coefficients. This order prevents unnecessary recalibration.
Before you act
Engineering checklist
- Confirm sample identity and time
- Check surface versus bulk objective
- Verify wet- or dry-basis calculation
- Review sealing and laboratory duplicates
- Compare density, depth and temperature
- Inspect sensor position and build-up
- Verify PLC scaling and averaging
- Check whether the application is outside range